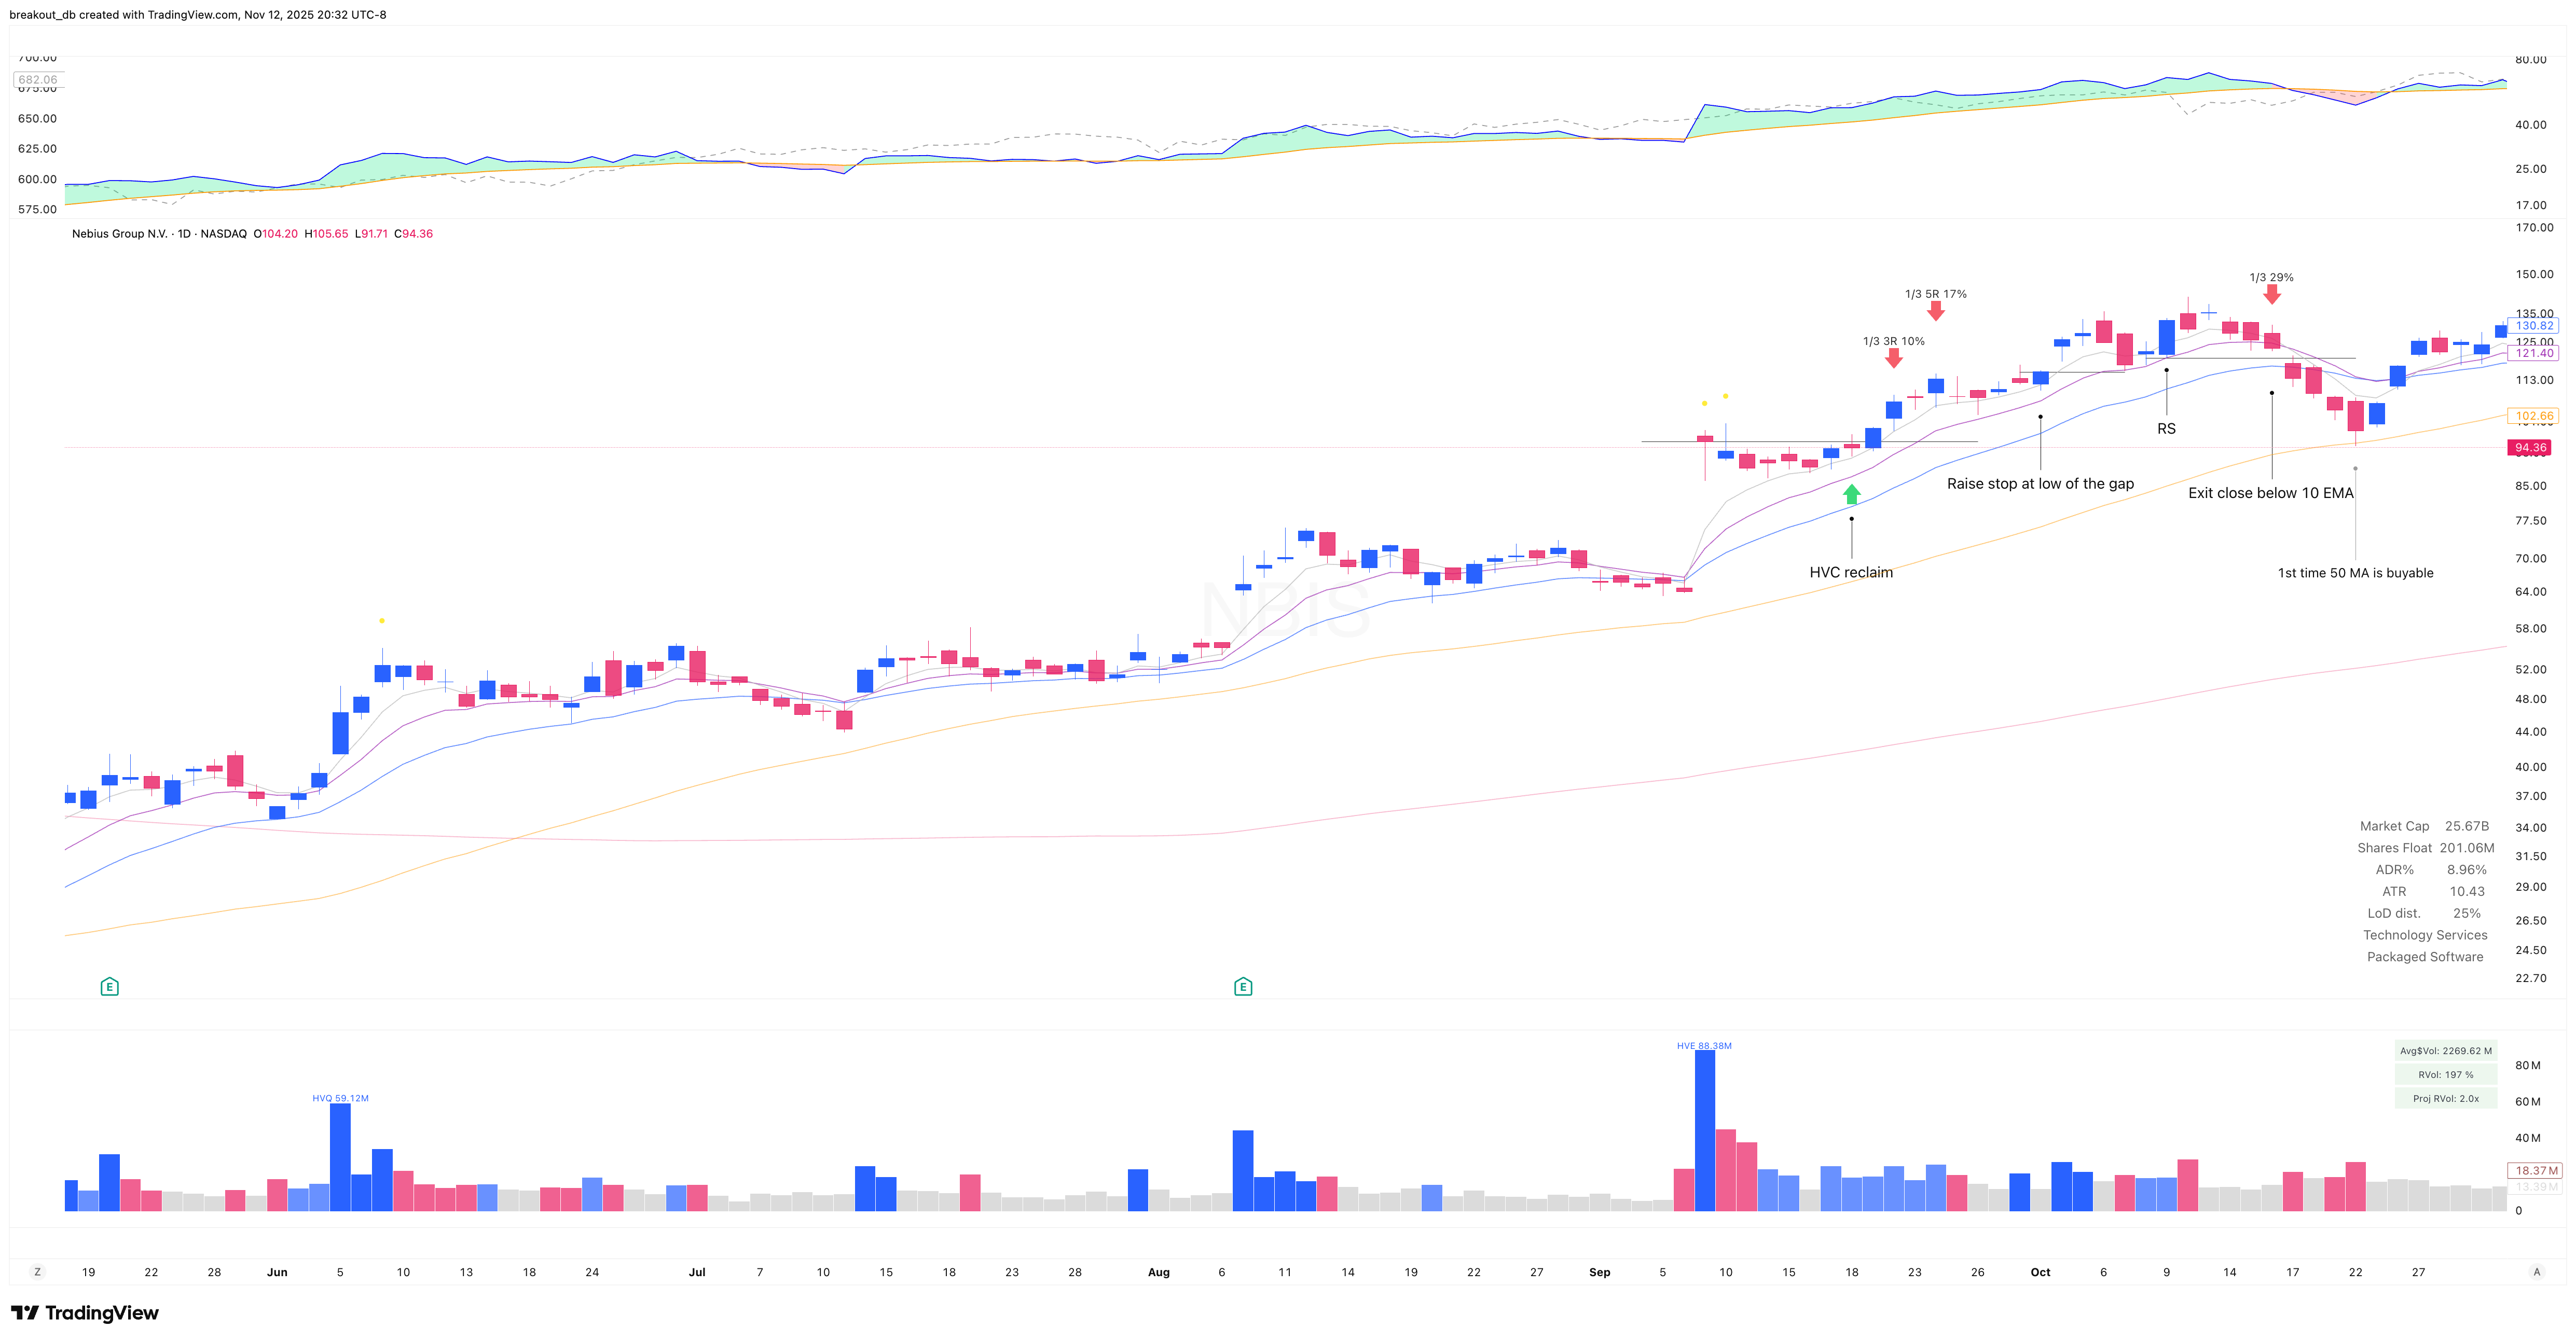
NBIS - Episodic Pivot - 2025-09-18
NBIS Trade Summary
Performance metrics and trade details for NBIS breakout.
- Stage
- 2
- Catalyst
- Earnings Report
- Risk
- 3.5%
- Gain %
- 15.0%
- Trade Duration
- 27 days
- Market Condition
- Bullish
- Market Cap
- $23.63B
- Shares Float
- 201.0M
- Entry
- Breakout
- Stop
- LoD
- Exit
- 10 EMA
- Reward Risk Ratio
- 4.3R
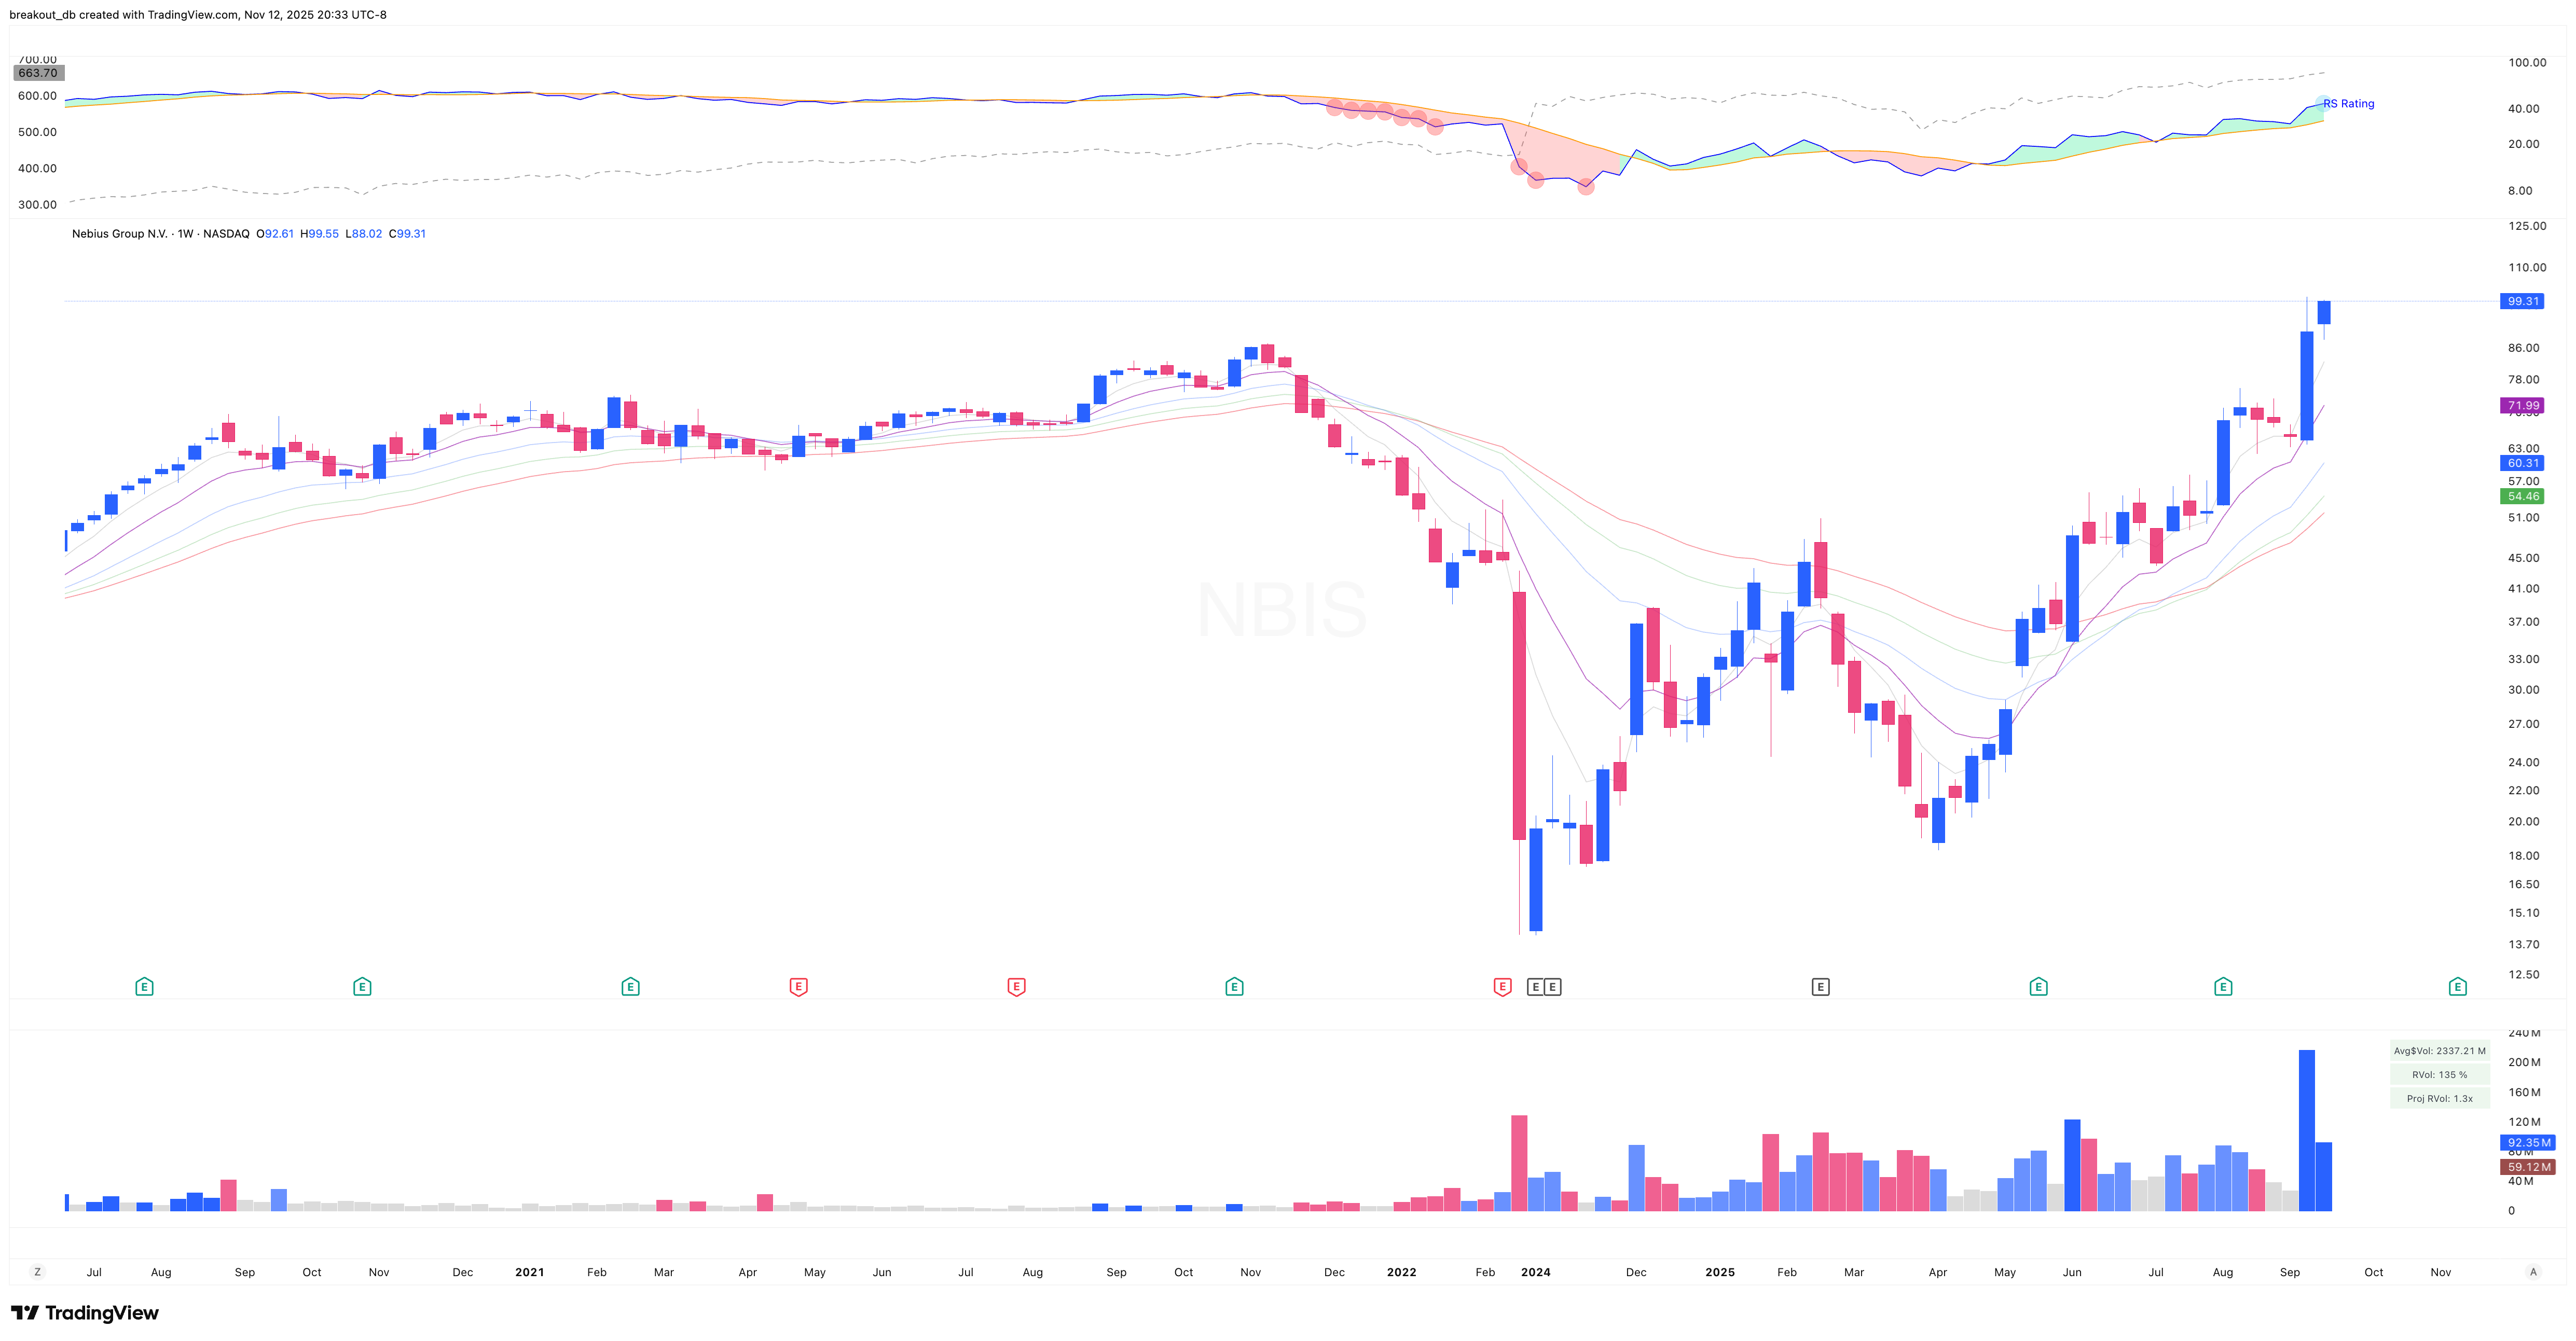
Before Breakout Weekly
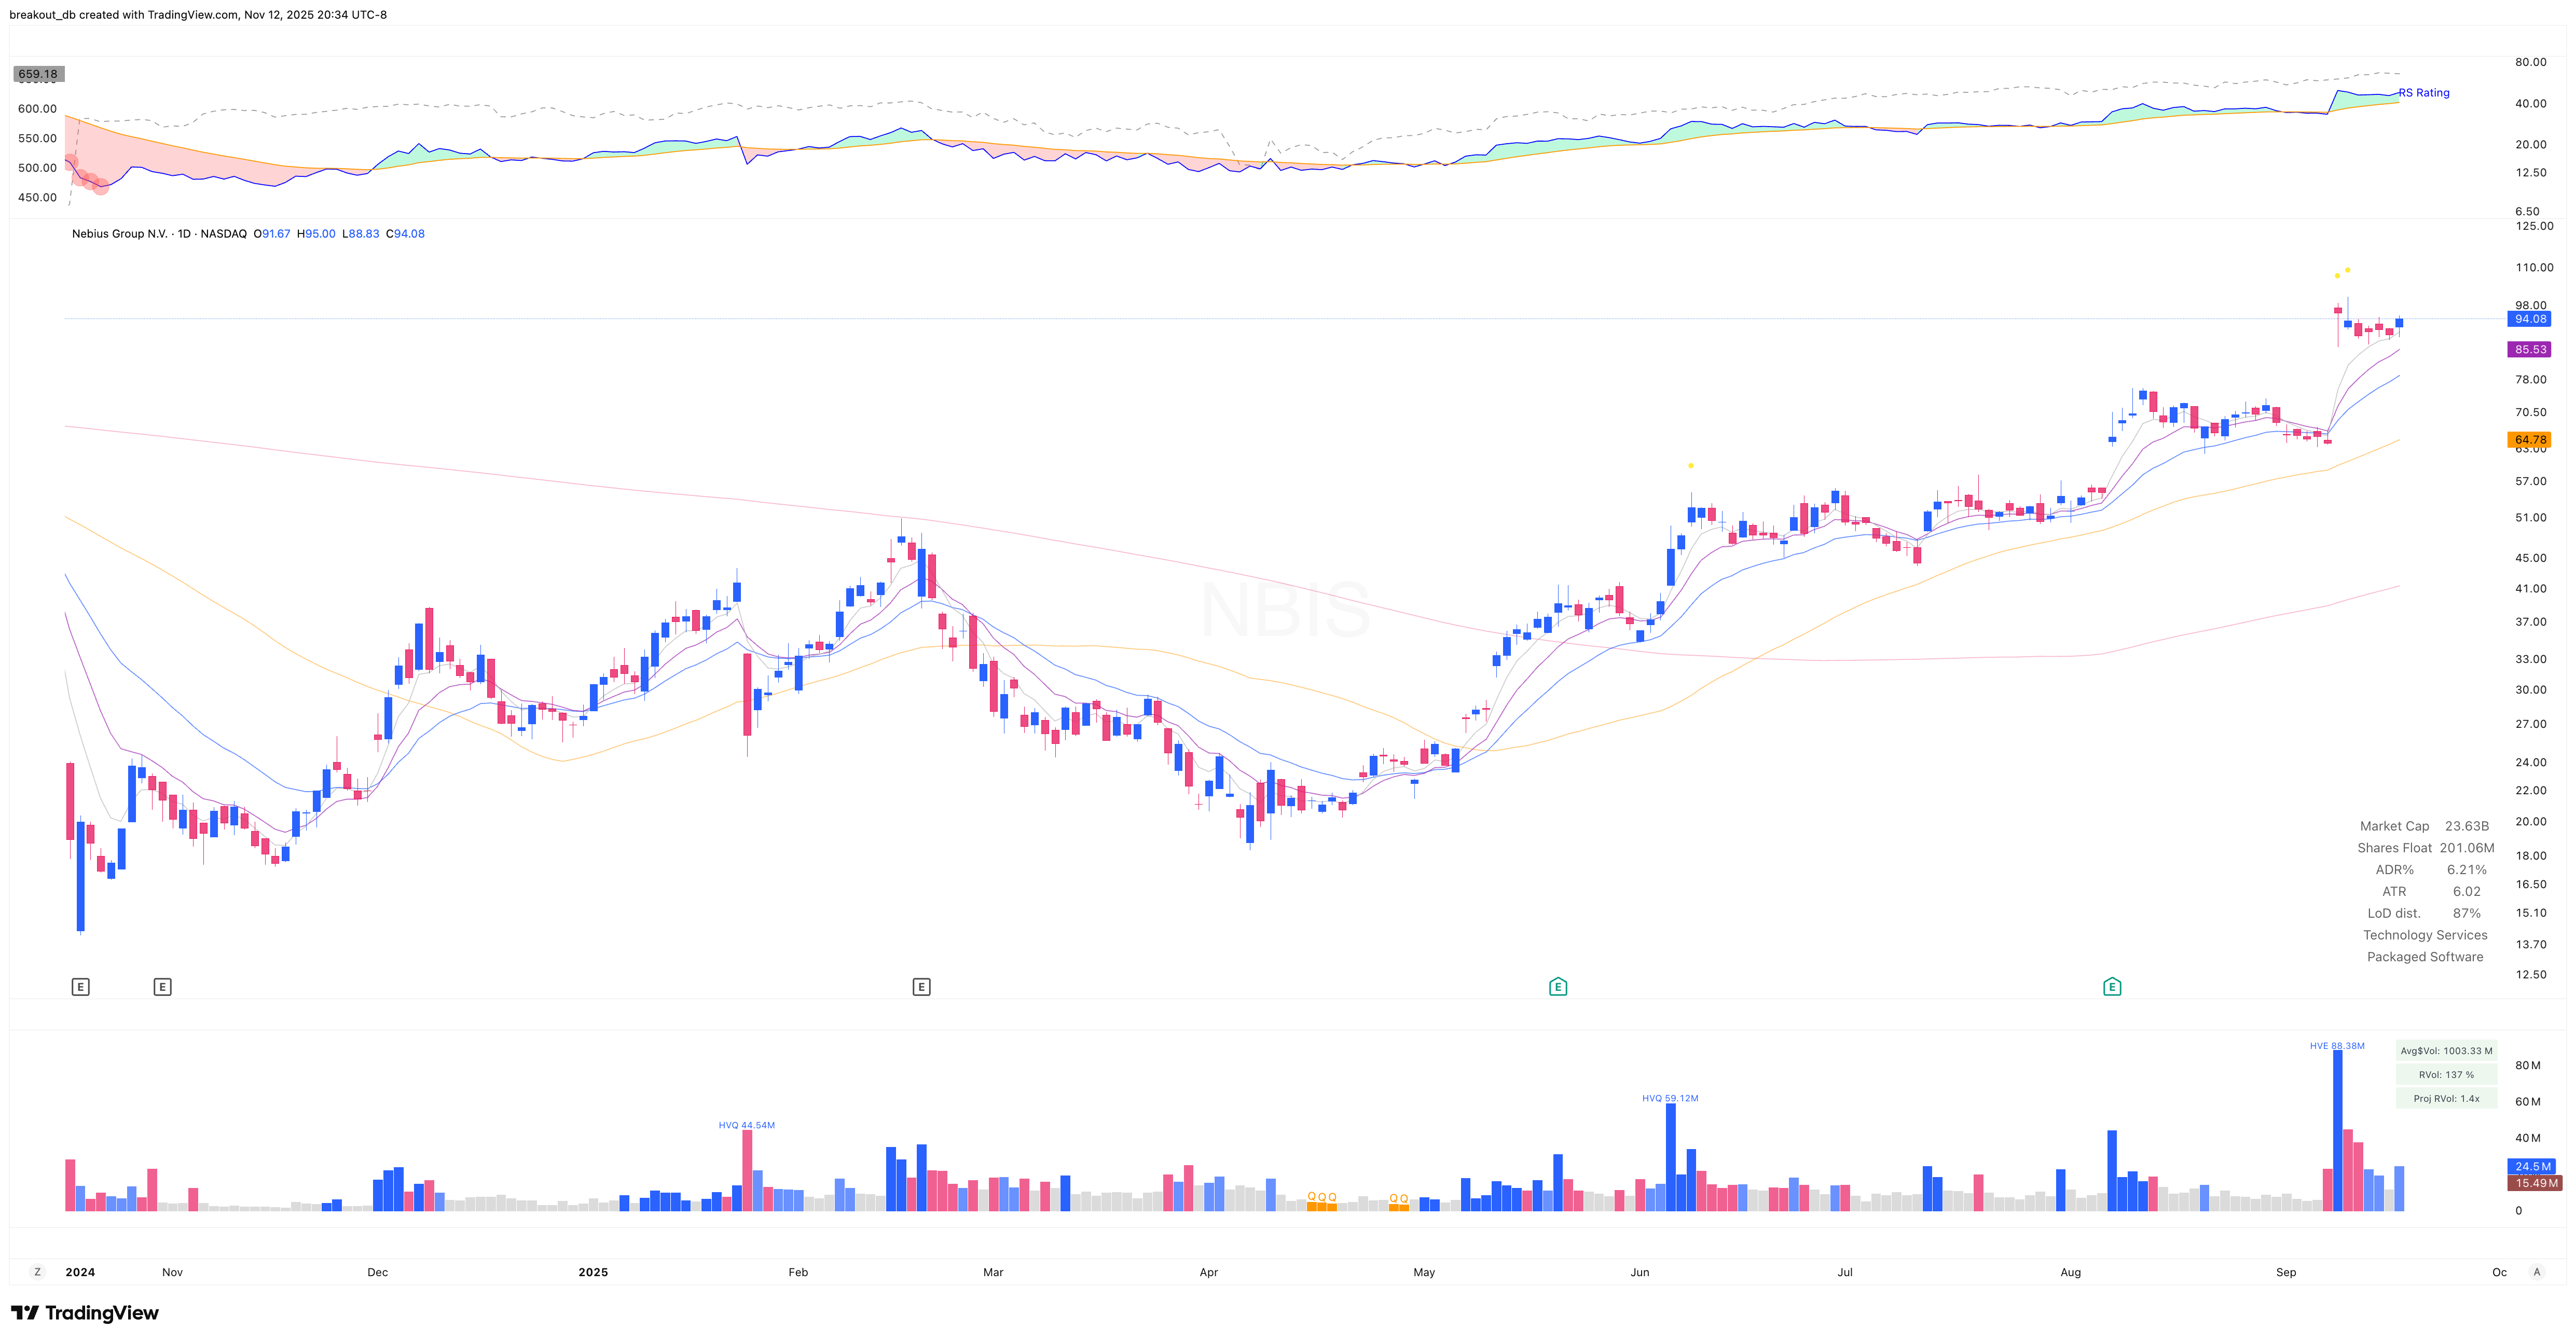
Before Breakout Daily
After Breakout