IE - VCP - 2025-12-19

IE Trade Summary

Performance metrics and trade details for IE breakout.

Stage
2
Risk
3.4%
Gain %
14.0%
Market Condition
Bullish
Market Cap
$2.09B
Shares Float
110.19M
Entry
Breakout
Stop
LoY
Reward Risk Ratio
4.1R

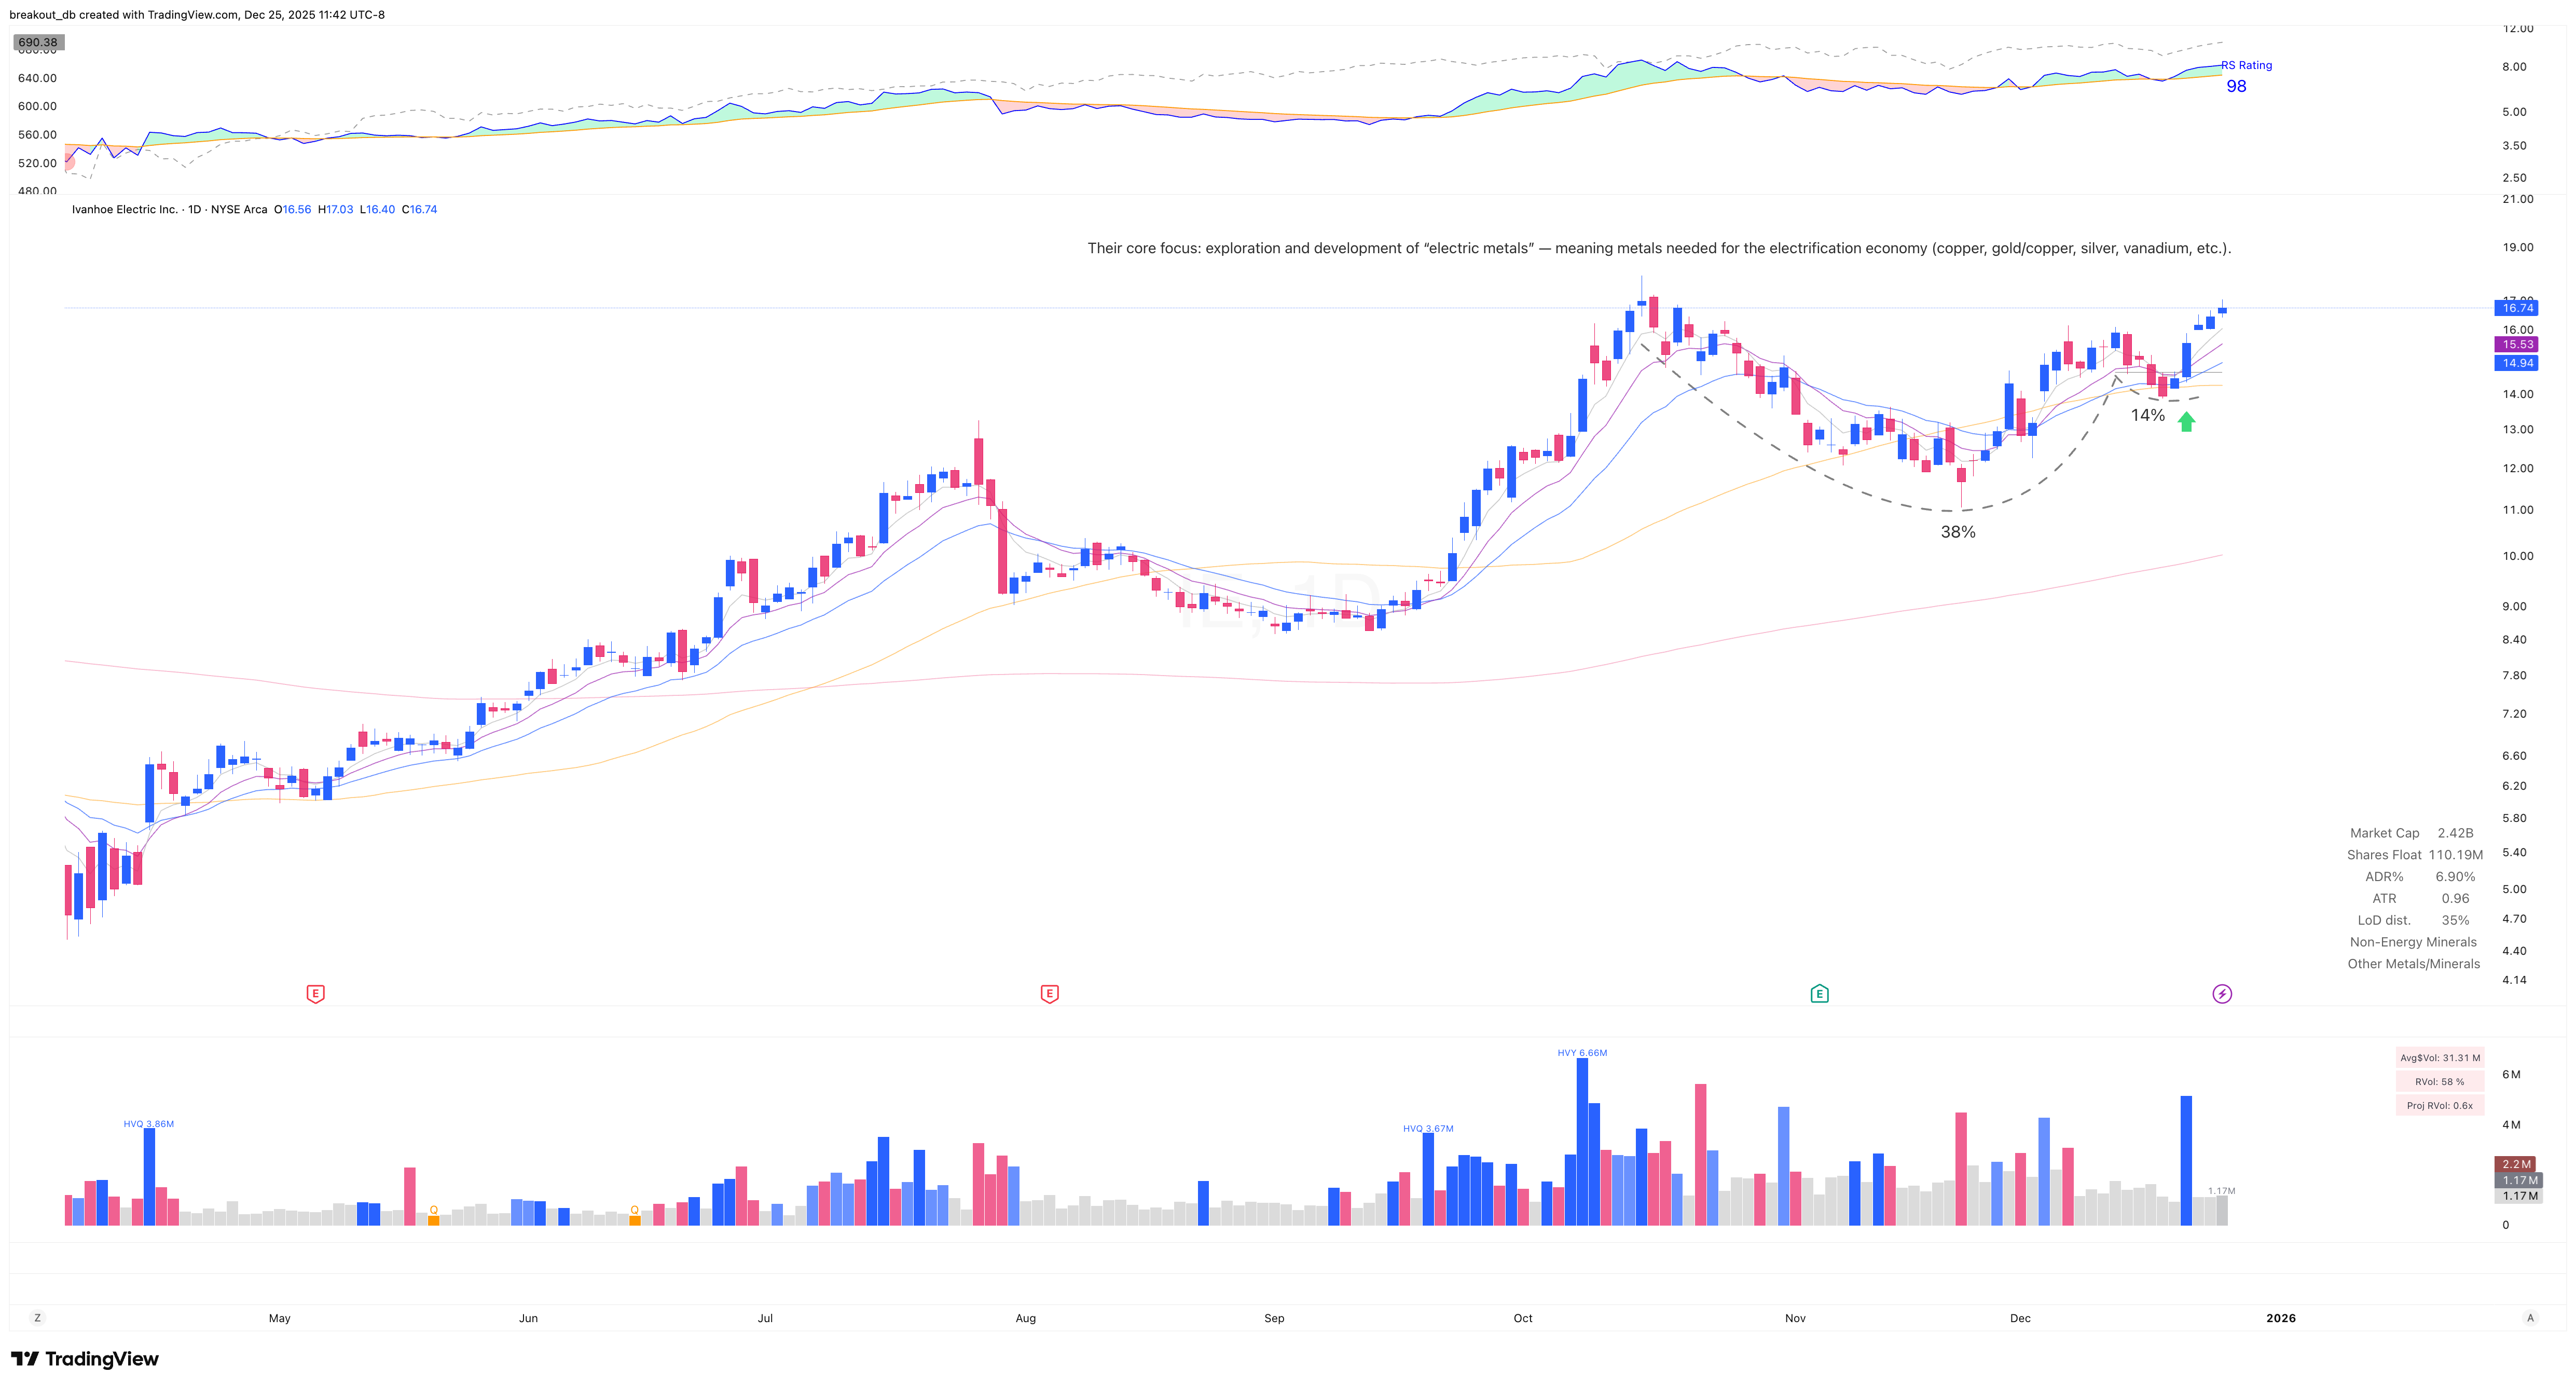
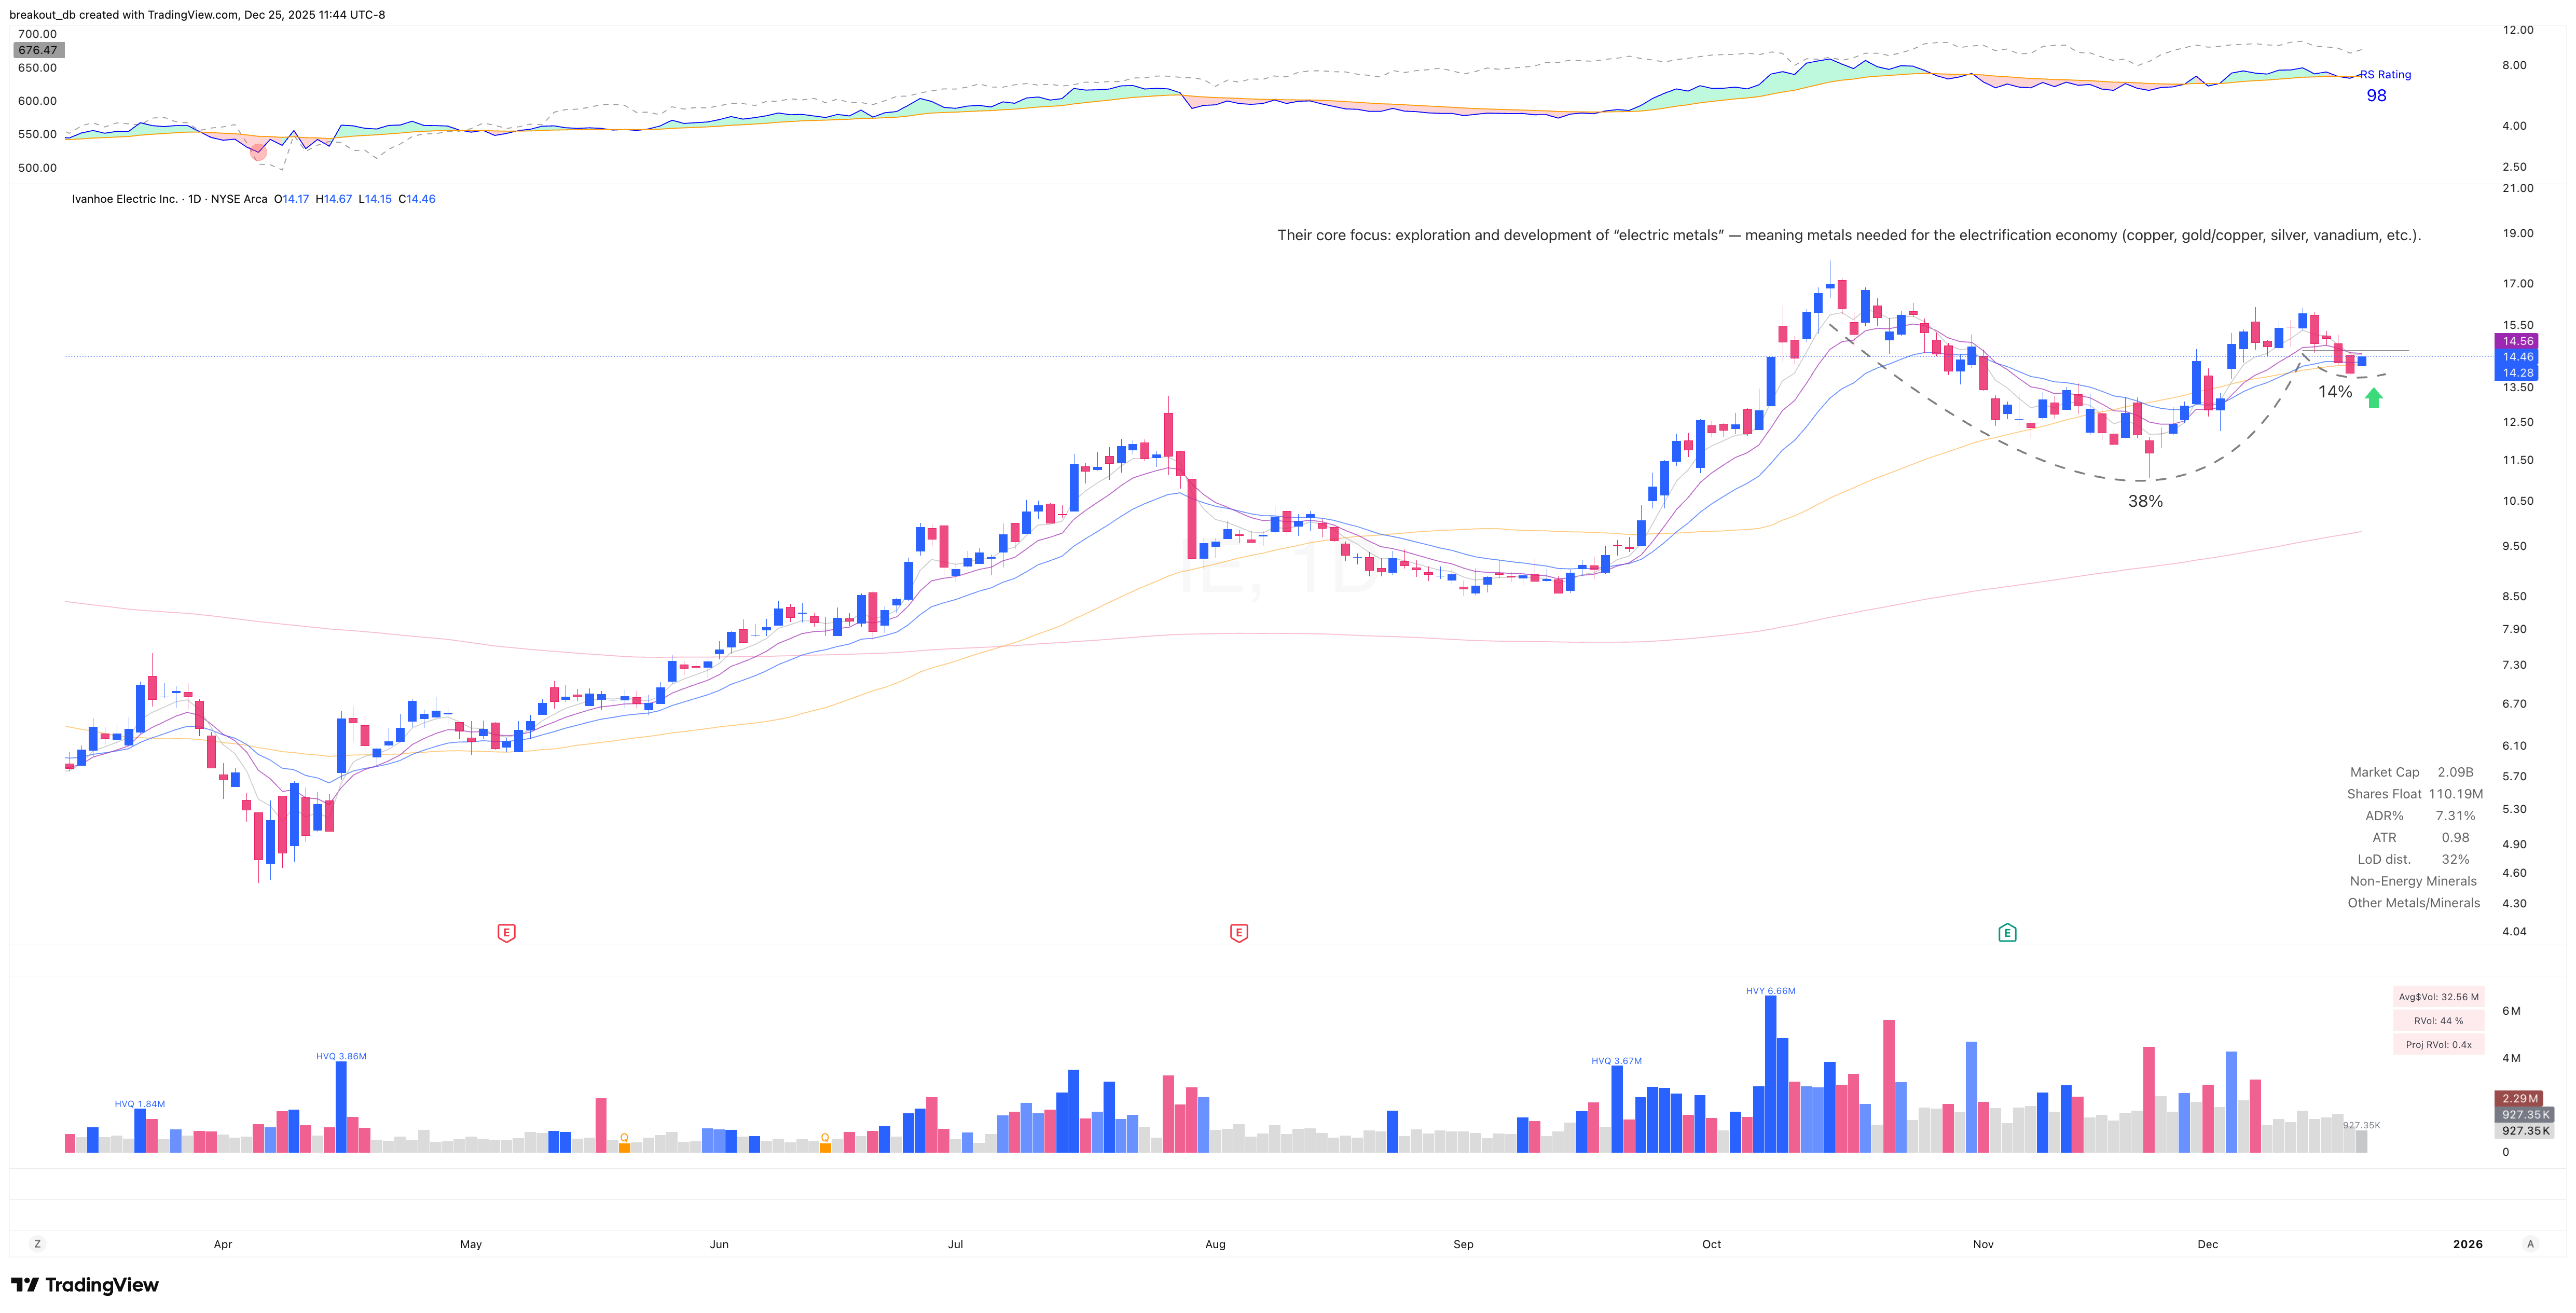
Before Breakout Weekly

IE - VCP - 2025-12-19 before breakout weekly

Before Breakout Daily
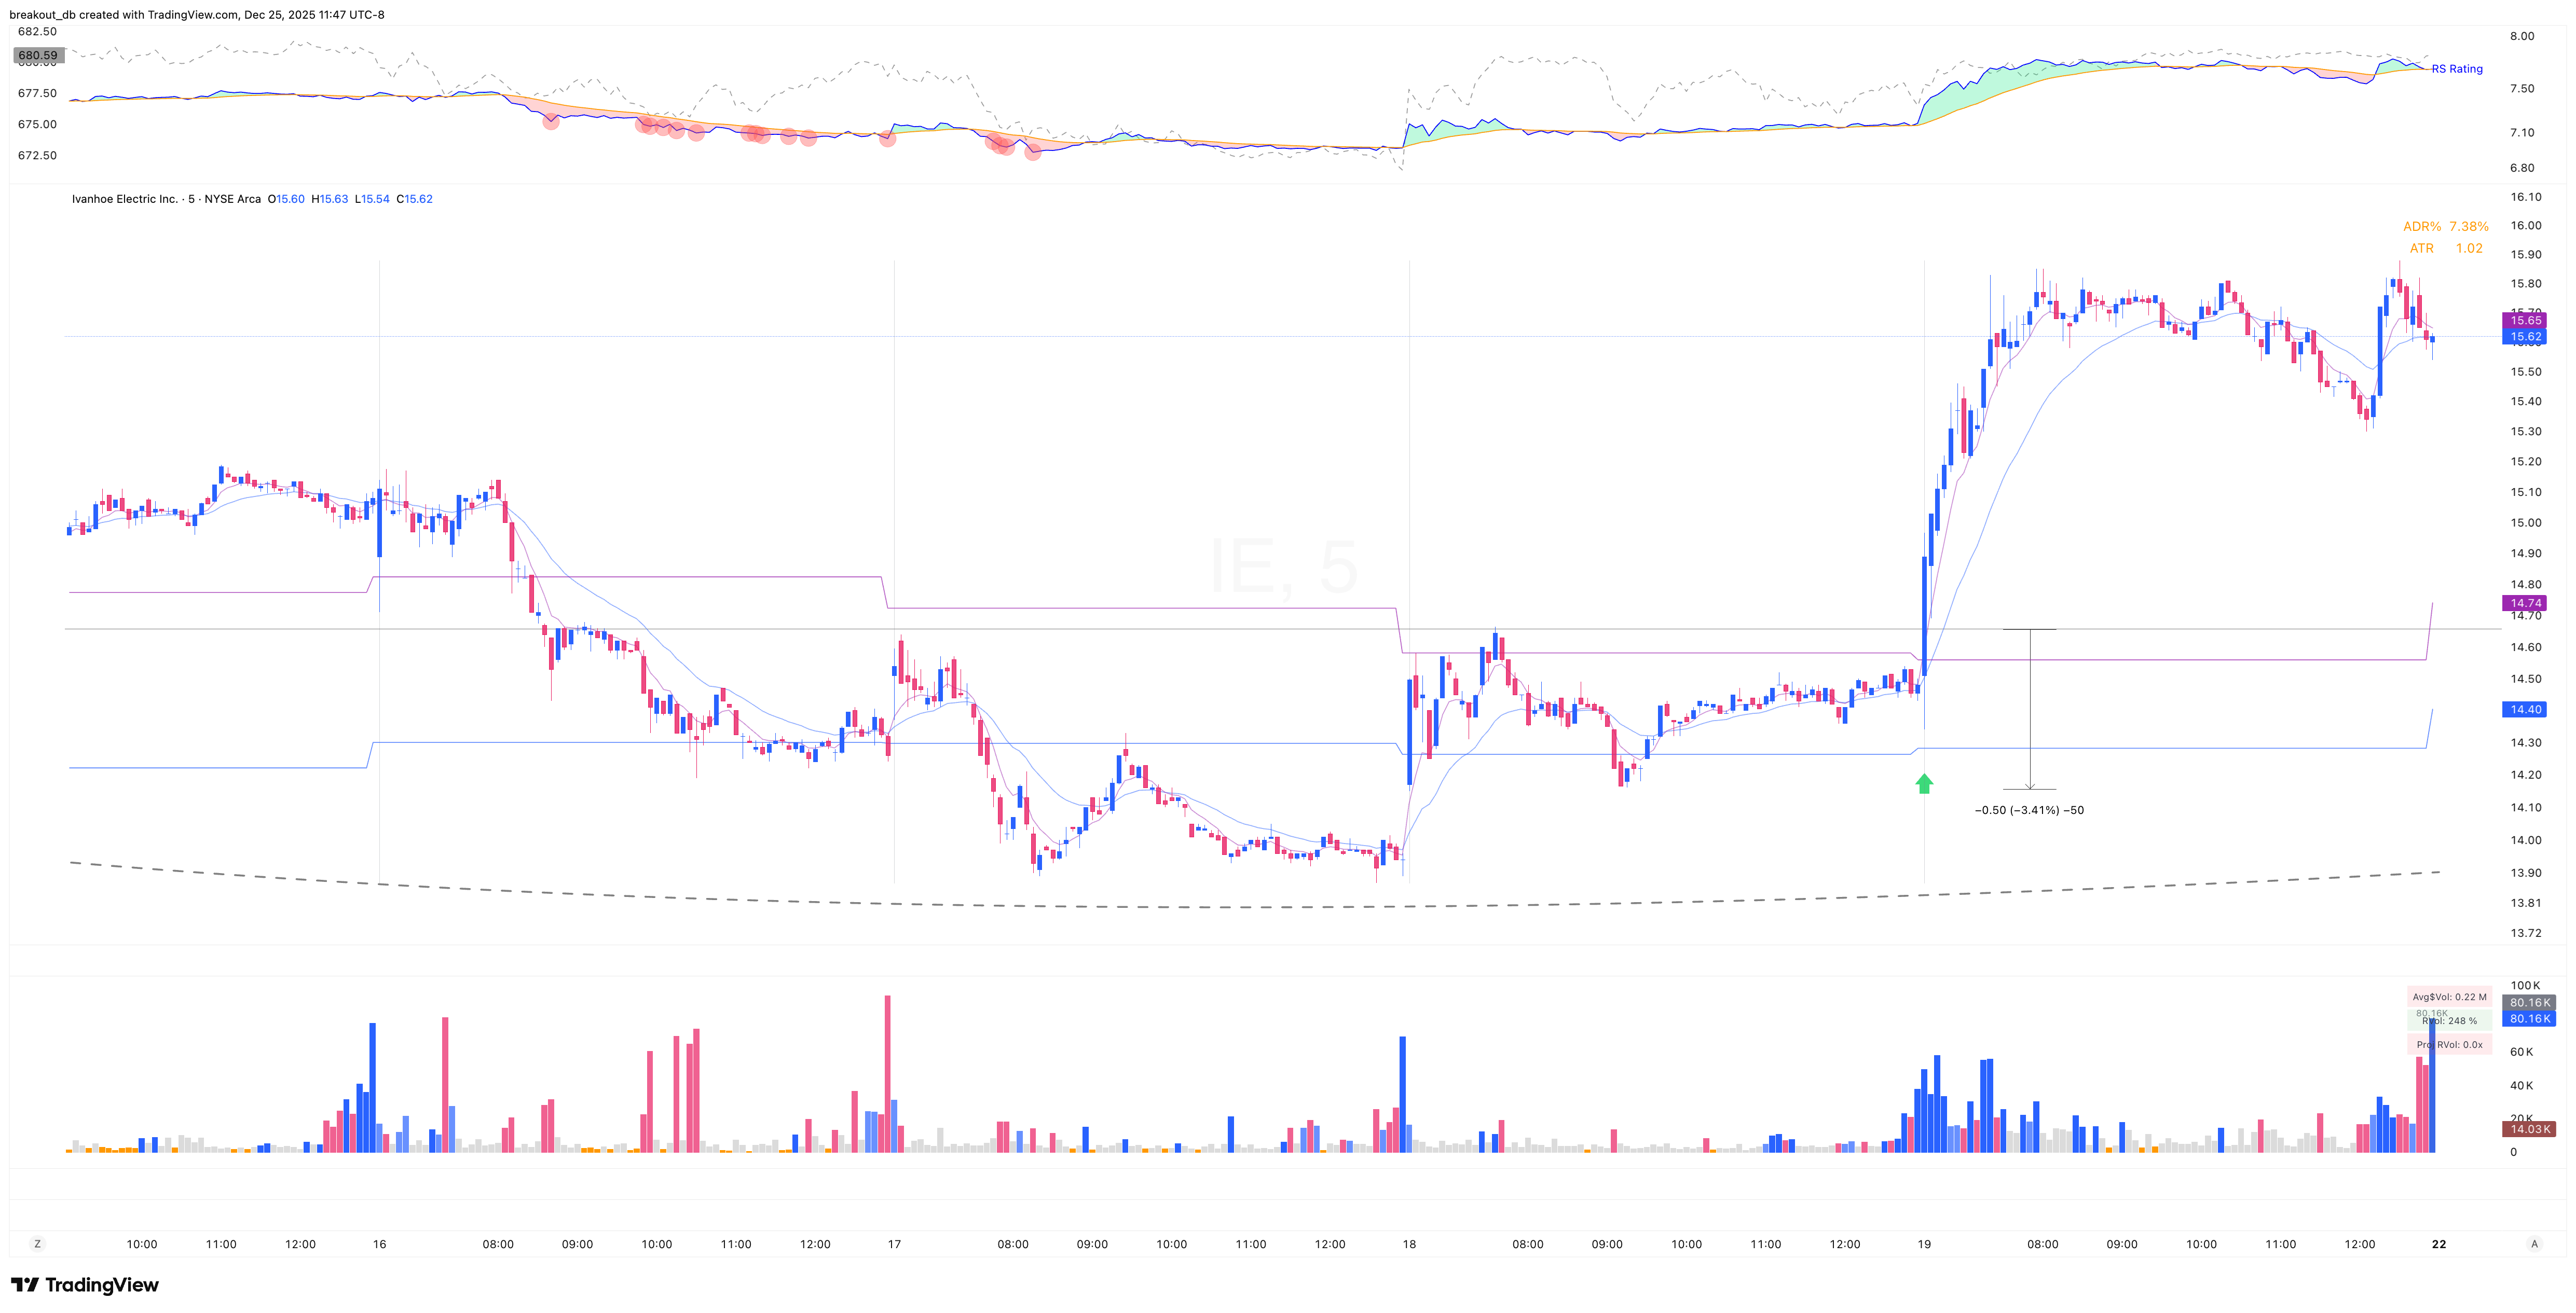
IE - VCP - 2025-12-19 before breakout daily

Intraday Entry

IE - VCP - 2025-12-19 intraday entry

After Breakout

IE - VCP - 2025-12-19 after breakout

Market Correlation Analysis for IE

Top Similar Tickers

Stocks that move in the same direction as IE

Positive
Rank Ticker Score
No similar stocks found in the current universe.

Top Inverse Tickers

Stocks that move opposite to IE

Negative
Rank Ticker Score
No inverse stocks found in the current universe.