APPS - Episodic Pivot - 2025-06-17

APPS Trade Summary

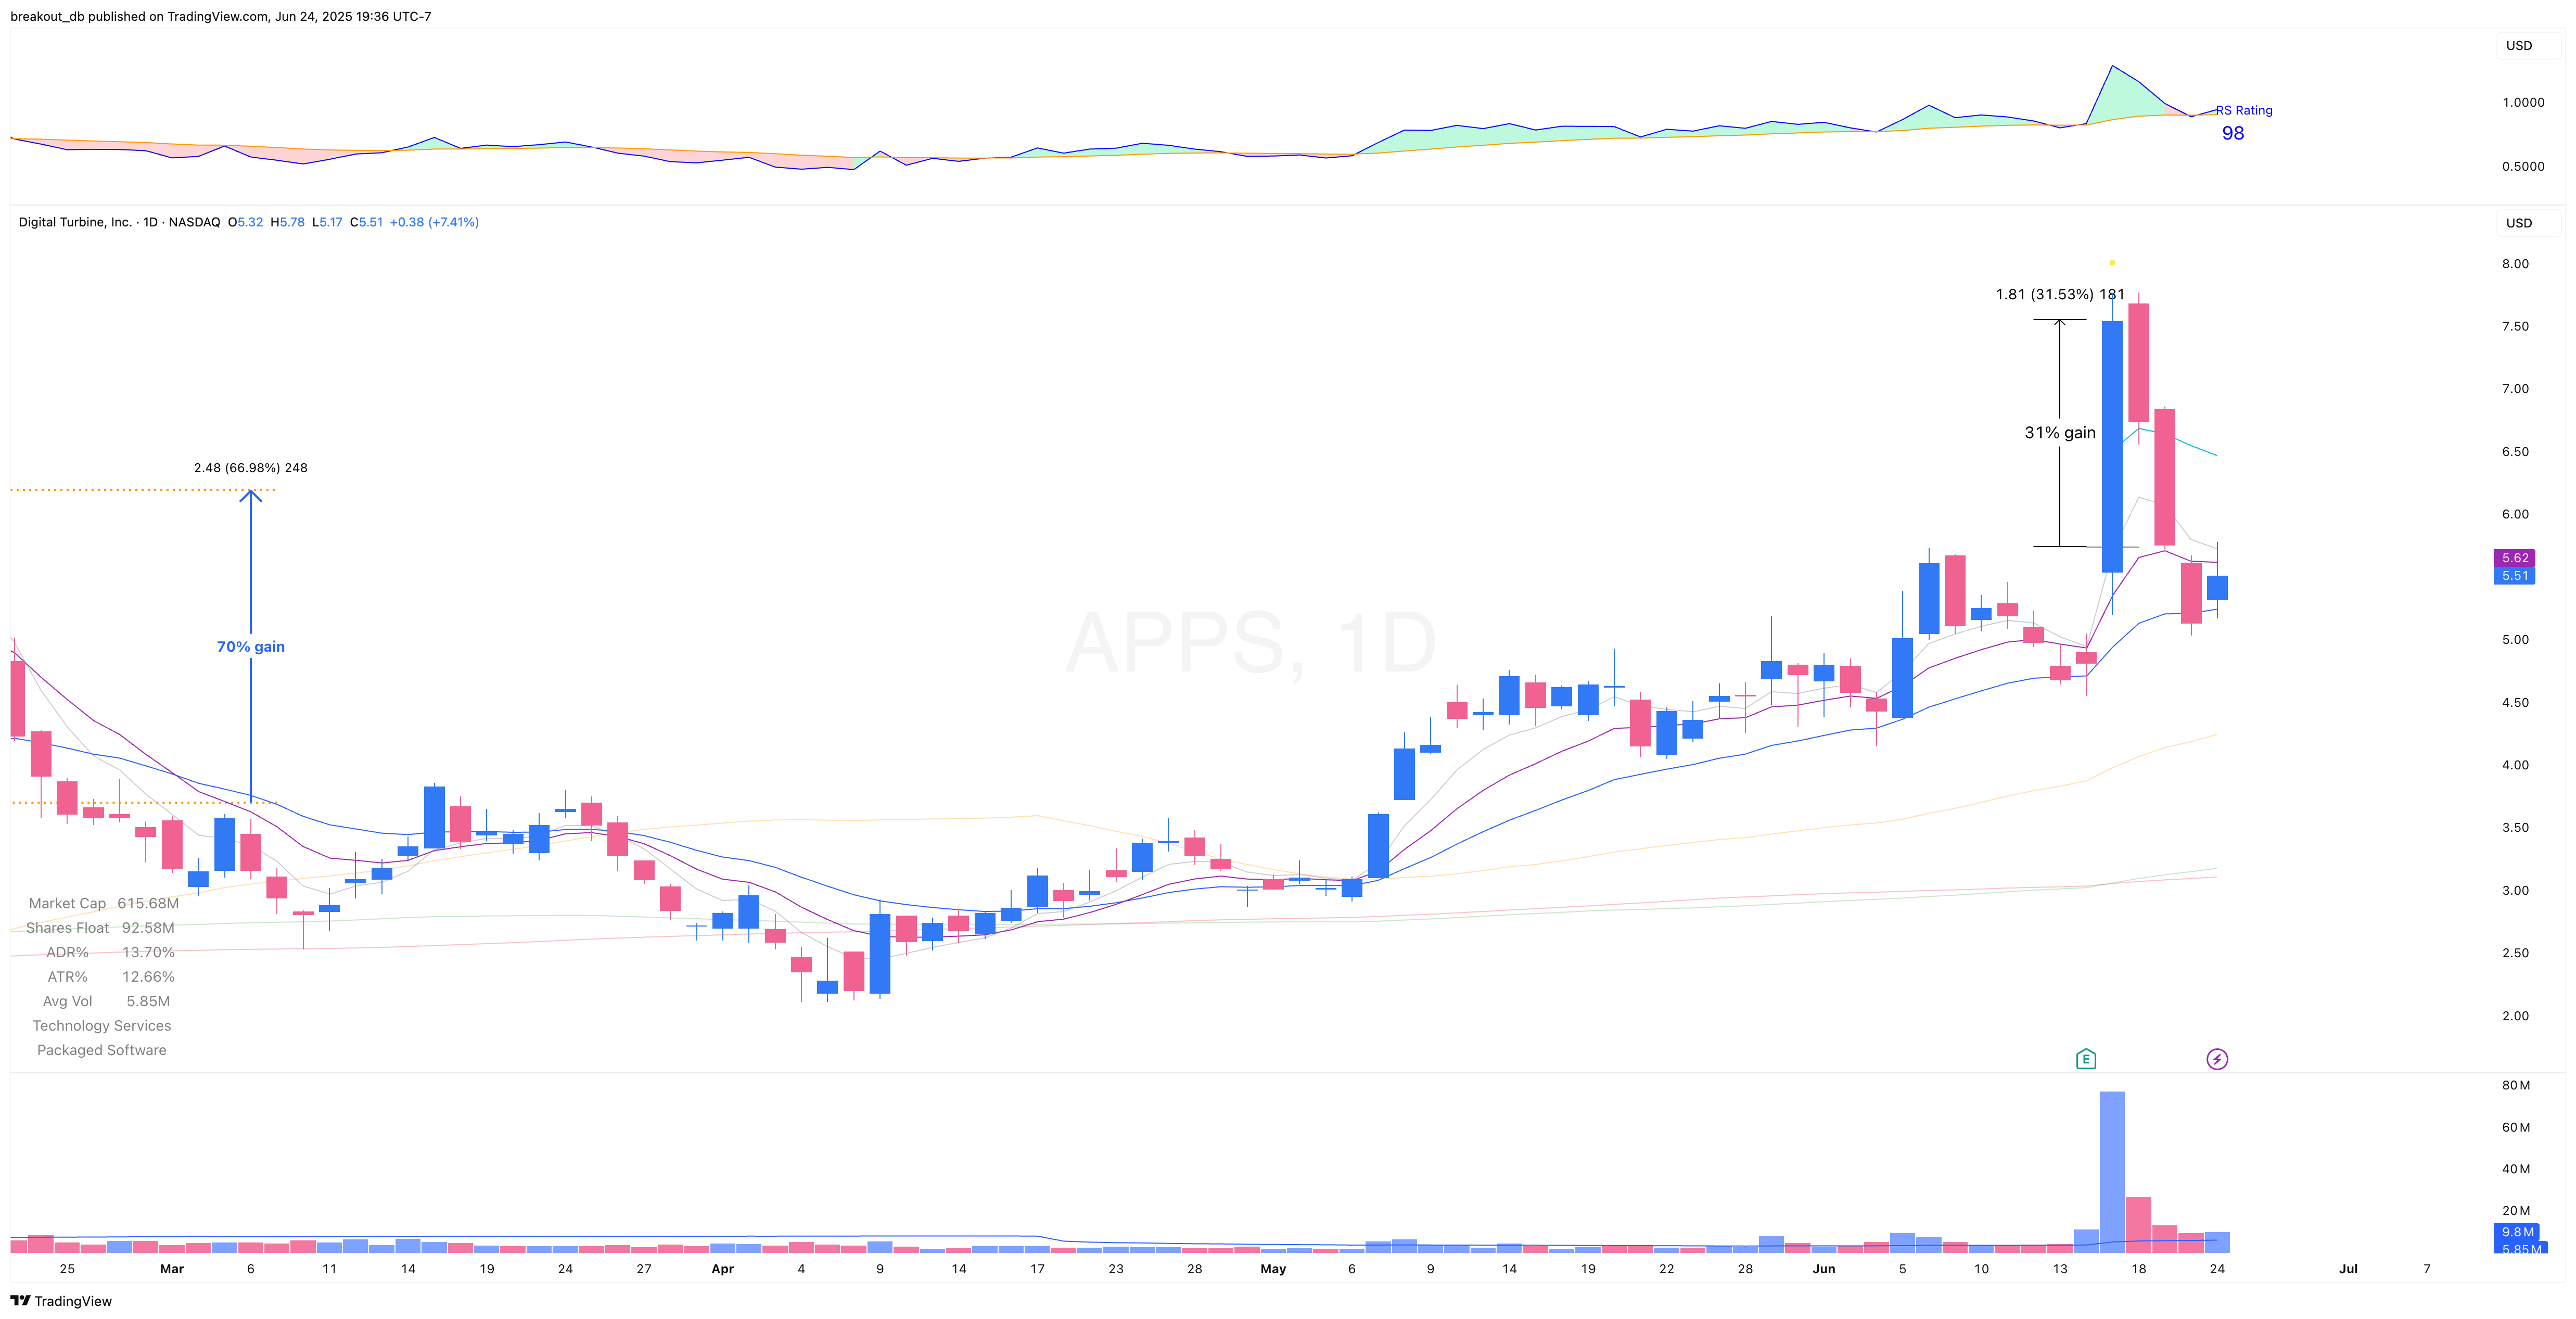
Performance metrics and trade details for APPS breakout.

Stage
2
Catalyst
Earnings Report
Risk
9.3%
Gain %
31.0%
Market Condition
Choppy
Market Cap
$0.51B
Shares Float
92.58M
Entry
OPB
Stop
LoD
Exit
Reached Target
Reward Risk Ratio
3.3R

Before Breakout Weekly

APPS - Episodic Pivot - 2025-06-17 before breakout weekly

Before Breakout Daily

APPS - Episodic Pivot - 2025-06-17 before breakout daily

Intraday Entry

APPS - Episodic Pivot - 2025-06-17 intraday entry

After Breakout

APPS - Episodic Pivot - 2025-06-17 after breakout

Market Correlation Analysis for APPS

Top Similar Tickers

Stocks that move in the same direction as APPS

Positive
Rank Ticker Score
No similar stocks found in the current universe.

Top Inverse Tickers

Stocks that move opposite to APPS

Negative
Rank Ticker Score
No inverse stocks found in the current universe.